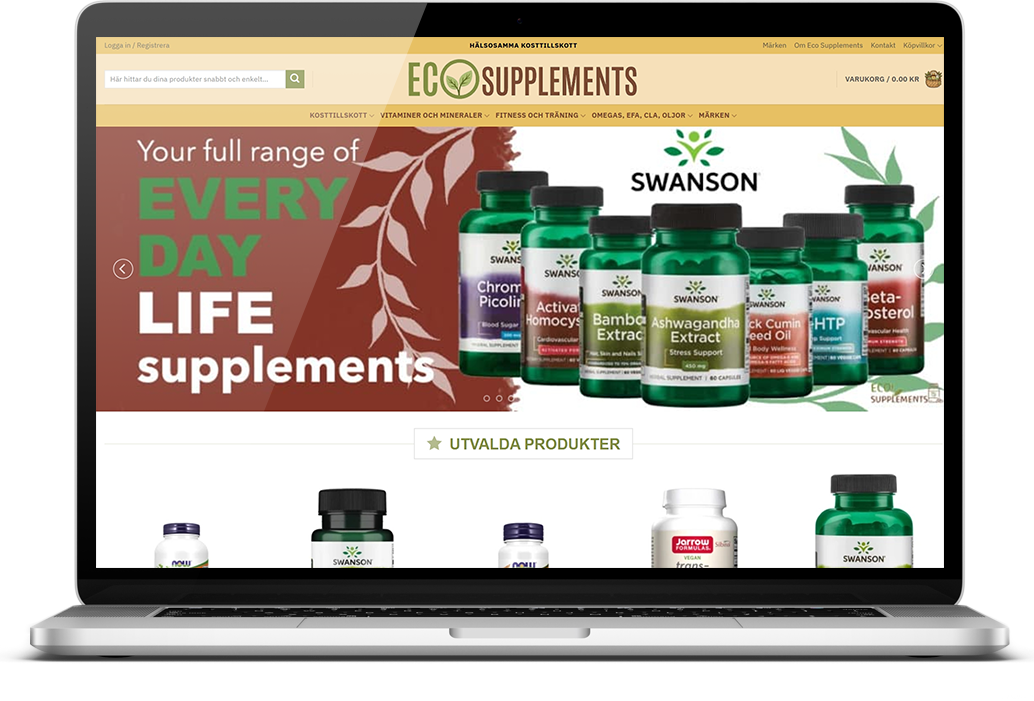
EU Supplement Retailer is a family-founded online supplement retailer offering over 4,500 natural, organic, and clean-label products across 18 EU country domains. Founded by two Swedish brothers, the business emphasises eco-friendly sourcing and a wide range of popular and trusted international brands.
When Hop AI engaged in December 2025, the account had strong ROAS potential but was hampered by a fragmented Google Merchant Center structure and widespread product feed errors. The business had ceiling-capped its growth and needed a partner to scale ads in existing markets and recreate successful strategies in new markets.
With 18 active EU domains, a 4,500+ product catalog, and proven conversion intent in the Nordics, the account had enormous untapped headroom. Melatonin and sleep supplements were already generating strong returns in Denmark and Sweden — but only a fraction of the catalog and geography was being activated.
Roughly 240,000 products in GMC, but only ~40,000 eligible to serve. All GMC accounts were set to the wrong country field, creating constant policy risk. Multiple campaigns were limited by feed errors. No Meta Ads were running. No structured seasonal strategy was in place.
The client knew their ROAS was strong but couldn't scale — every time budget was increased, Performance Max campaigns lost efficiency. The root cause was a combination of feed quality issues and incorrect GMC account structures. Scaling required rebuilding the infrastructure, not just raising bids.
Migrated all 18 EU domains to correct, country-specific Merchant Center accounts — eliminating the Sweden country field issue that was creating ongoing policy suspension risk. Transitioned smoothly to product feeds with improved structure based on best practices while preserving campaign performance data through the transition.
Audited and recommended specific improvements to the product attributes to resolve critical feed errors including misclassified products, missing descriptions, unescaped HTML, and policy violations. Developed structured title templates to improve ad relevance and product eligibility across the catalog.
Built a Performance Max and Shopping campaign matrix across priority markets — Sweden, Denmark, Czech Republic, Netherlands, Spain, Hungary, and Ireland. Each campaign uses product-category-specific asset groups with localised ad copy (DK, SE, FI, ES) and tROAS targets calibrated per market's demand dynamics.
Applied continuous tROAS calibration across the PMax portfolio — cutting targets to unlock volume, raising them to lock in efficiency — allowing Google's algorithm to converge on high-intent buyers. Simultaneously launched Meta Catalog Ads across priority markets targeting interest-based audiences with a variety of messaging styles, building a full-funnel paid media engine.
After an aggressive scaling phase in January, the account underwent precision optimisation from February through April. The result: ROAS climbed from 777% to 965% while cost per purchase fell — proving that smart algorithmic management compounds over time.
Key Google Ads Learnings
The campaign architecture was built to grow market by market — starting with proven Scandinavian markets, then applying the same playbook to Central and Western Europe. Each new market launched with product-category-specific asset groups, localised ad copy, and tROAS targets calibrated to local demand dynamics before budget was scaled.
Core market. Multiple product categories active across Performance Max. Highest overall ROAS in the portfolio — sleep supplements and vitamins both performing strongly.
Both Google Ads and Meta Ads active. Insights gained from this market shaped the broader Meta expansion strategy across the portfolio.
Expansion market with strong early results. Both Performance Max and Shopping campaigns running, with revenue growth sustained across controlled budget scaling steps.
Premium vitamin category performing well. Cost per purchase improved consistently while budget was increased — a clear signal of healthy market demand.
Active Performance Max campaigns. Part of the Western European expansion phase, with localised Spanish-language asset groups and country-specific tROAS targets.
Newest markets in the portfolio. Performance Max launched with learnings from earlier markets applied from day one — efficiency ramp expected to be faster than prior launches.
Meta Ads scaled from zero to 5.29× ROAS in under 90 days. The channel expanded methodically — testing one variable at a time across markets, product verticals, domains, and messaging styles. This discipline made it possible to isolate what actually drives performance rather than guessing. The winning combination turned out to be three things working together:
April's 5.29× ROAS is the compounding effect of those lessons — learned through structured testing, then applied at scale.
| Month | Strategy | ROAS | vs Prior Month | Cost per Purchase |
|---|---|---|---|---|
| Jan 2026 | Initial launch · interest-based audiences | 2.49× | — New launch | Stabilising |
| Feb 2026 | Market expansion · new audiences tested | 2.02× | −19% | Elevated (expansion phase) |
| Mar 2026 | Multi-market testing · optimisation | 2.22× | Testing phase | Elevated (new markets) |
| Apr 2026 | Focused spend · higher-converting campaigns | 5.29× | +138% | −49% |
April represented the clearest proof of the strategy's maturity: both channels hit their highest efficiency simultaneously, while combined spend was rationalised — demonstrating that the account no longer needed volume to generate returns.
The team's decision to rebuild GMC accounts correctly before pushing budget was counter-intuitive but critical. Without fixing the country field issues and feed errors, every scaling attempt would have hit the same ceiling. The technical foundation work completed at the start of the engagement made all subsequent growth possible.
The consistent tROAS calibration philosophy — cutting targets to unlock volume, raising them to capture efficiency — treated Google's algorithm as a partner, not an obstacle. A single well-timed bid adjustment on one campaign delivered a +113% ROAS improvement in a single month, demonstrating the disproportionate value available when the algorithm is ready to respond.
Leading Meta Ads with a high-specificity supplement category — one where Meta's algorithm can efficiently find people actively seeking a solution to a clear need — proved significantly more effective than starting with broader, general-purpose products. This insight shaped the entire Meta expansion strategy and informed which product categories to prioritise across each channel.
In March, the account generated more revenue on 17% less spend — a direct result of reallocating budget from underperforming campaigns to the highest-efficiency ones. This disciplined budget-to-performance matching, with continuous monitoring and fast reallocation when market dynamics shifted, ensured every euro was directed to where it converted most profitably.